
Your time tracking data probably lies to you every single day — and your managers know it but can't prove it
Walking through a manufacturing client's facility last month, I watched their operations manager pull up three different dashboards. Each showed different numbers for the same metric: average task completion time. The production dashboard said 47 minutes. The HR system showed 52 minutes. The project management tool displayed 38 minutes.
"Which one do we use for the quarterly review?" she asked.
The Three-Tier Governance Problem Nobody Talks About
Most businesses fail at three distinct levels when handling time data. Each failure makes the next one worse.
Operational Level Floor managers and team leads need immediate, actionable data. They're making decisions every hour about task allocation, overtime approval, and workflow adjustments. Instead, they get weekly reports that mash everything into meaningless averages.
Managerial Tier Department heads and middle managers need to spot trends, compare team performance, and justify resource requests. They receive either too much detail or executive summaries that hide critical variations.
Strategic Leadership Executives need metrics that connect time investment to business outcomes. They typically get the same utilization percentages and efficiency ratios that operational managers use for scheduling.
Each tier needs different data, different validation, different timing. Most companies force everyone to use the same dashboard with the same metrics refreshed at the same intervals. No wonder time tracking becomes a compliance exercise instead of a decision tool.
The disconnect gets expensive fast. Operational managers make staffing decisions based on stale data. Executives approve budgets using metrics that don't predict actual costs. Middle management gets stuck translating between two incompatible worldviews.
Why Raw Time Data Creates Dangerous Illusions
A logistics company we worked with showed warehouse workers averaging 6.2 productive hours per 8-hour shift — a 77.5% utilization rate that looked reasonable on paper.
Accurate time tracking made effortless.
GoTimio empowers your team to log, monitor, and manage work hours seamlessly.
- Real-time time tracking
- Automated timesheet approvals
- Payroll and billing integration
No credit card required
The CFO wanted to cut labor costs. The data seemed to support it. Nearly a quarter of paid time appeared unproductive.
Except the metric was garbage.
Those "unproductive" gaps included mandatory equipment checks, safety briefings, and transition time between loading bays. The time tracking system only counted active scanning as productive. Workers learned to game the system, scanning random items during legitimate breaks to avoid appearing idle.
The fastest workers rushed through safety protocols. The careful ones who followed procedures showed lower productivity scores. The metrics actively punished good behavior.
This happens everywhere. A consulting firm tracks billable hours but ignores the research time that makes those hours valuable. A dental practice measures patient face-time but misses the sterilization and setup that enables it. A software team logs coding hours but not the architecture discussions that prevent months of rework.
Raw time data without context doesn't just mislead — it drives destructive decisions.
Time tracking systems capture events, not value. An electrician spends 20 minutes diagnosing a complex wiring issue and 5 minutes fixing it. Traditional metrics show 80% "non-productive" time. But that diagnosis prevents a house fire. Which part actually created value?
Building Your Three-Tier Framework
Forget trying to build one perfect dashboard. You need three distinct governance layers, each with its own validation rules and reporting cycles.
Here's a simple workflow overview.
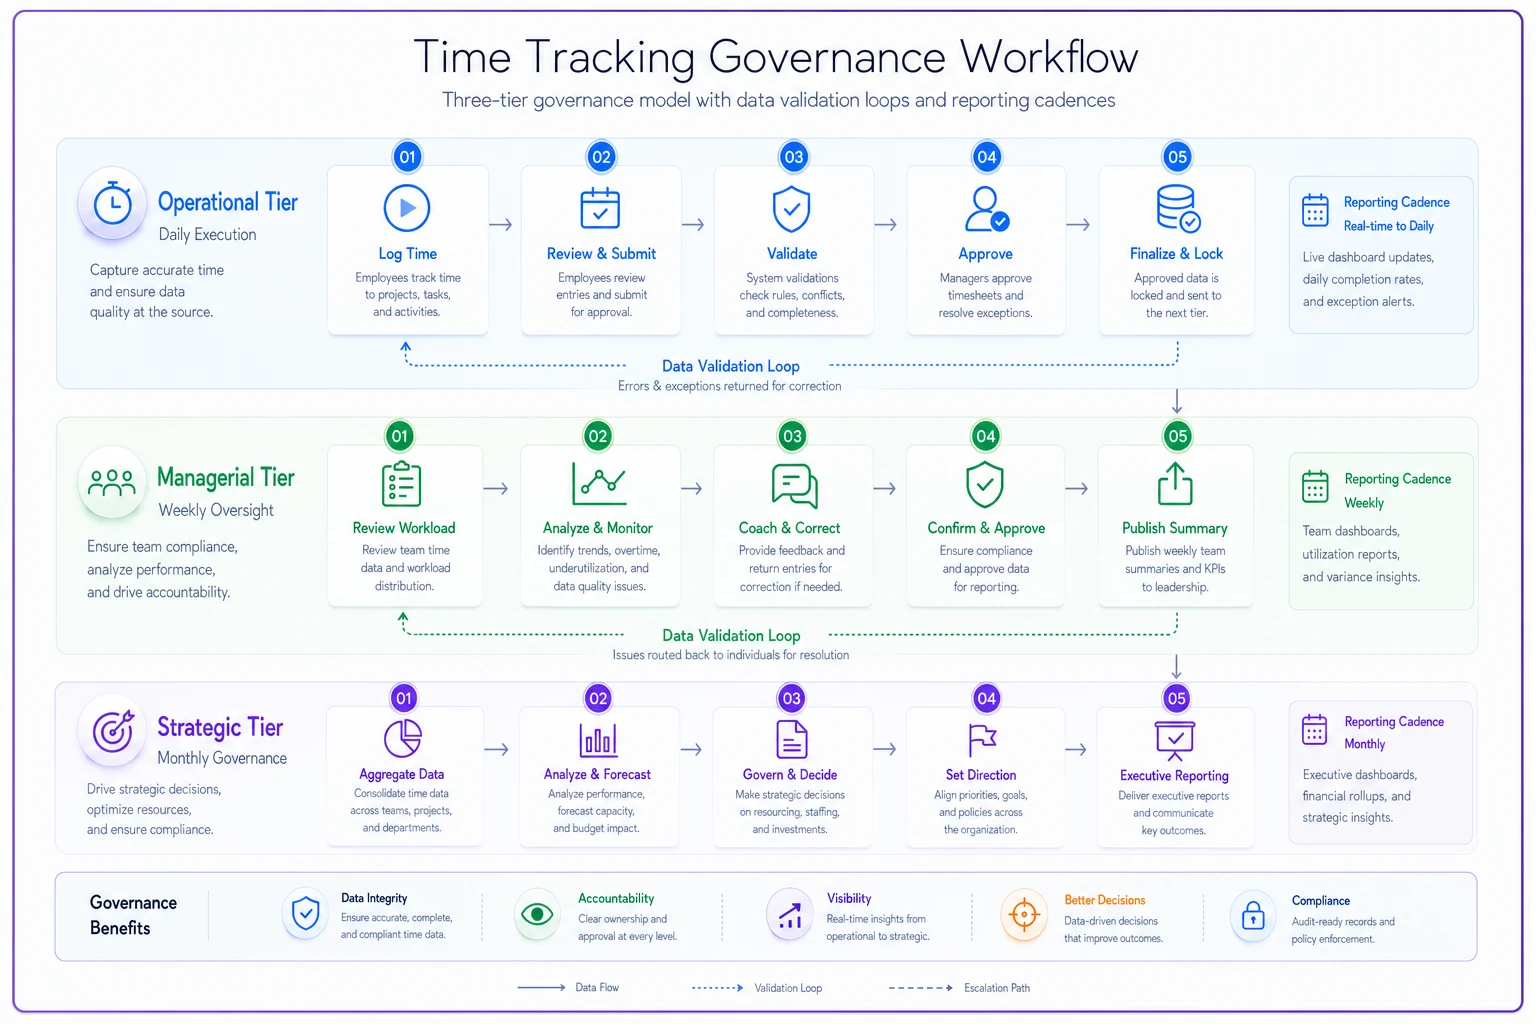
Operational Tier (Daily/Hourly)
Start with what floor managers actually control. They can reassign tasks, approve overtime, and adjust workflows in real-time. Their metrics must reflect immediate reality.
For a repair shop, operational metrics might include:
-
Current bay utilization (refreshed every 30 minutes)
-
Technician availability status (real-time)
-
Job completion variance from estimate (updated on close)
-
Next-hour capacity vs scheduled arrivals (rolling forecast)
These aren't productivity percentages or efficiency scores. They're decision triggers. A manager seeing three bays empty with five arrivals in the next hour can immediately pull a technician from routine maintenance to diagnostic work.
The validation here happens through exception reporting. Any time entry more than 20% over or under estimate triggers review. Any gap longer than 15 minutes requires classification. This catches both system errors and real operational issues before they compound.
Operational metrics die if they're not instantly actionable. The repair shop manager doesn't need to know that technician productivity averaged 73% last month. They need to know that Bay 3 has been empty for 40 minutes while appointments are backing up in Bay 1.
Managerial Tier (Weekly/Biweekly)
Middle management needs pattern recognition, not task detail. They're staffing next month's schedule, evaluating training needs, and identifying process bottlenecks.
A home services company might track:
-
Service completion rates by technician tier
-
Callback frequency correlated with job duration
-
Travel time percentage by service area
-
Revenue per dispatched hour (not per worked hour)
These metrics reveal systemic issues. If senior technicians consistently run 30% over estimate on certain job types, that's either a training opportunity for juniors or a pricing model problem. If travel time in one service area exceeds 40% of billed time, that territory needs route optimization or possibly its own crew.
Validation at this tier focuses on consistency and completeness. Weekly variance reports flag any team or individual whose metrics shifted more than 15% from their rolling average. Missing data gets imputed based on historical patterns, but flagged for investigation.
The key insight: managerial metrics must predict resource needs, not just measure past performance. When callback rates correlate with rushed job times, you can staff accordingly for quality instead of just speed.
Strategic Tier (Monthly/Quarterly)
Executive metrics must connect time investment to business outcomes. Utilization rates and efficiency scores mean nothing if they don't drive profitability and growth.
Real strategic metrics look different:
-
Customer lifetime value per invested labor hour
-
Market share capture rate vs competitor response time
-
Innovation time allocation vs new revenue generation
-
Operational capacity vs sales pipeline coverage
A regional HVAC company discovered their highest "productivity" teams had the worst customer retention. Fast service calls meant rushed diagnostics and incomplete fixes. Customers needed multiple visits, eventually switching to competitors who fixed issues properly the first time.
Strategic validation requires correlation analysis. Time metrics must demonstrably connect to financial outcomes. If increased "productivity" doesn't improve margins, customer satisfaction, or market position, you're measuring the wrong thing.
Strategic metrics should answer one question: does this time allocation create sustainable competitive advantage? Everything else is operational detail.
Sample Dashboards That Actually Drive Decisions
Operational Dashboard (Restaurant Chain)
| Metric | Current Value | Alert Threshold | Action Trigger |
|---|---|---|---|
| Kitchen Station Load | Station 3: +8 min behind | >5 minutes | Immediate task rebalancing |
| Server Turnover | Table 12: 47 min occupied | >45 minutes | Check order status |
| Prep Tasks | 72% complete for dinner rush | <80% by 3 PM | Reassign prep staff |
| Labor Cost Rate | $42/hour vs $38 target | >$40/hour | Early release evaluation |
The shift manager doesn't need perfect data — they need actionable intelligence. During lunch rush, the dashboard shows Station 3 running 8 minutes behind while Station 2 has slack. The manager immediately shifts tasks. The same dashboard at 2 PM highlights excess front-of-house staff as sales drop, triggering early releases to maintain labor targets.
Notice what's missing: no utilization percentages, no efficiency scores, no weekly averages. Just decision points and thresholds that trigger immediate action.
Managerial Dashboard (Digital Agency)
The account director monitors:
-
Project profitability by phase and team
-
Revision cycles correlated with initial time investment
-
Client communication time as percentage of project hours
-
Resource allocation vs pipeline requirements
When revision cycles spike on projects where discovery phase was compressed, the pattern becomes obvious. The director implements minimum discovery requirements, even for "simple" projects. Revisions drop 40% over the next quarter.
This dashboard predicts problems instead of just reporting them. High communication percentages predict scope creep. Low discovery investment predicts rework. The patterns let management intervene before projects explode.
Strategic Dashboard (Regional Healthcare Network)
The executive team tracks:
-
Provider utilization vs patient access metrics
-
Referral conversion time vs competitor benchmarks
-
Administrative burden trends across specialties
-
Capacity investment ROI by service line
They notice cardiology showing high utilization but losing market share. Deeper analysis reveals appointment delays driving patients to competitors. The strategic decision: add capacity even at lower utilization to recapture market position. Traditional productivity metrics would have suggested the opposite.
Strategic dashboards often reveal counterintuitive truths. Lower utilization sometimes creates higher profit. Longer service times can improve lifetime value. The metrics must capture these trade-offs.
The Validation Framework Most Companies Skip
Bad data is worse than no data. Every tier needs validation checks that catch issues before they corrupt decisions.
Input Validation
Set reasonable boundaries on data entry. A task can't take negative time. A worker can't log 26 hours in a day. Travel time can't exceed total shift duration.
But smart validation goes deeper. If someone typically takes 45-60 minutes for a task type, flag entries under 20 minutes or over 90. Either they're gaming the system, the task scope changed, or you've discovered a training opportunity.
Automate range checks to reduce manual cleanup and focus investigations where they matter most.
Input validation catches human error and system gaming before they poison your metrics. The goal isn't perfect data — it's consistent enough data to support good decisions.
Consistency Validation
Compare related metrics for logical alignment. If project hours increase but task completion doesn't, something's wrong. If overtime spikes but output remains flat, investigate immediately.
A construction company found their time tracking showed 20% more hours than their access control system recorded on site. Workers were logging drive time as work time because the mobile app started tracking when they left home. Simple fix once identified, but it had inflated labor costs for months.
Consistency checks reveal systematic problems that single-metric analysis misses. When multiple data sources disagree, one of them is lying.
Outcome Validation
The ultimate test: do time metrics predict business results? If your "productivity improvements" don't flow through to margins, customer satisfaction, or growth, the metrics are wrong.
Track correlations quarterly. Which time metrics actually predict profitability? Which ones just create busy work? Be prepared to abandon metrics that don't demonstrate real business impact.
A staffing agency tracked "recruiter productivity" as calls per hour. Productivity went up 30% over six months. Placement rates dropped 15%. Revenue fell 8%. The metric optimized for activity, not results. They switched to tracking qualified candidate presentations per week. Both placement rates and revenue recovered.
Reporting Cadence That Matches Decision Cycles
Stop forcing everyone onto the same reporting schedule. Different decisions happen at different speeds.
Operational decisions happen constantly. Managers need alerts and exceptions in real-time, summaries every shift, patterns daily.
Managerial planning operates in weeks. Monday's report drives Thursday's schedule. This month's trends inform next month's targets.
Strategic choices unfold quarterly or annually. Monthly reports track progress, but major pivots wait for sufficient data to confirm trends.
A manufacturing client tried forcing everyone onto daily reports. Executives got overwhelmed with noise. Operations managers needed hourly data for line adjustments. The compromise: automated alerts for exceptions, daily operational summaries, weekly management reports, monthly executive dashboards. Each tier sees what they need when they need it.
The reporting cadence should match the decision cadence. Daily data for daily decisions. Quarterly data for quarterly strategy. Mixing these up creates either information overload or decision delays.
Common Implementation Pitfalls
Perfect Data Paralysis
Teams spend months trying to get 100% accurate time tracking before building any governance. You don't need perfect data — you need consistently imperfect data that's good enough for decisions.
Start with the operational tier using whatever data you have. Add validation rules as you discover problems. Build managerial metrics once operational data stabilizes. Strategic metrics come last, after you understand what operational patterns actually predict business outcomes.
Metric Proliferation
Someone always suggests tracking "just one more thing." Before long, you're back to dashboard overload. Each tier should have 5-7 core metrics, maximum. More than that and decision-makers can't focus on what matters.
Technology First Thinking
Many companies buy expensive time tracking platforms thinking better software solves governance problems. The framework comes first, technology second. You can implement three-tier governance with spreadsheets if necessary. The thinking matters more than the tools.
Breaking Free from Misleading Metrics
The path forward isn't complicated, but it requires abandoning one-size-fits-all thinking about time tracking productivity metrics.
Start by mapping decisions to data needs. What choices does each management tier actually make? What information would change those decisions? Build metrics and validation from those requirements, not from what your time tracking system easily reports.
Different stakeholders need different truths from the same underlying data. Your warehouse supervisor cares about hourly throughput. Your CFO cares about labor cost per unit shipped. Both are valid, neither is complete.
Implement validation at collection, not just reporting. Catch bad data before it corrupts aggregations. Flag anomalies before they become "trends."
Most importantly, tie time metrics to business outcomes. If a metric doesn't predict something that matters — revenue, retention, margins, growth — stop tracking it. Replace vanity metrics with decision drivers.
AI-powered operational software makes this three-tier approach much more practical to implement. Instead of building three separate dashboards manually, intelligent systems can automatically segment the same data for different stakeholder needs. They flag exceptions in real-time for operations, identify patterns for management, and correlate time metrics with business outcomes for strategic review.
The Competitive Reality
Companies that get this right pull ahead fast. They make better staffing decisions because they understand true capacity. They price accurately because they know real cost structures. They improve continuously because they measure what matters.
Your competitors probably still chase utilization rates and efficiency scores that mean nothing. They make decisions based on averages that hide critical variation. They force everyone to pretend the same dashboard serves every need.
While they argue about whose numbers are right, you'll be making informed decisions at every level. Operations responds to real-time reality. Management spots trends before they become problems. Leadership invests based on demonstrated returns.
The businesses still treating time tracking as compliance will wonder how you consistently outmaneuver them. You turned time data into decision intelligence while they collected meaningless metrics.
Your time tracking system generates thousands of data points daily. The question isn't whether you're measuring enough. It's whether you've built the governance framework to transform that data into competitive advantage.
Keep pretending one dashboard serves everyone, or build the three-tier framework that turns time tracking productivity metrics into real operational intelligence. Your competitors are hoping you choose wrong.
Ready to optimize your workforce time management?
Join 2,000+ companies using GoTimio to improve timesheet accuracy, reduce payroll errors, and boost team productivity.