
Most businesses track time religiously but have no idea what their projects actually cost. You bill $50,000 for a project, everyone celebrates, then three months later you realize you barely broke even after factoring in real labor costs, overhead, and all the indirect expenses that somehow never made it into the original estimate.
That disconnect between tracked hours and real profitability kills businesses slowly. Not because they can't deliver projects — they deliver fine. But because they systematically underprice work, allocate resources poorly, and make expansion decisions based on revenue instead of actual margins.
Why traditional time-to-profitability calculations mislead everyone
The typical approach looks deceptively simple. Take your billable rate, multiply by hours worked, subtract direct costs, and there's your profit. Except this ignores how businesses actually operate.
Your senior developer bills at $150/hour but costs you $85/hour in salary and benefits. Great, $65/hour profit, right? Wrong. That developer generates zero billable hours during sprint planning, code reviews, team meetings, training junior staff, or fixing production issues. Their actual utilization hovers somewhere around 65-70% on good months. Meanwhile, they consume office space, equipment, software licenses, management time, and admin support — none of which appears in that simple hourly calculation.
The real challenge isn't tracking time or calculating rates. It's building a model that accurately distributes all your costs across projects in a way that survives scrutiny from both internal stakeholders and external auditors. Finance wants defensible numbers. Project managers need actionable data. Clients occasionally demand cost breakdowns. Your model needs to satisfy all of them without becoming a bureaucratic nightmare.
Building rate-mapping crosswalks that actually reflect costs
Start with your actual cost structure, not wishful thinking. Pull twelve months of payroll data and categorize every person by their primary function. Don't just look at salaries — include payroll taxes, benefits, PTO accrual, everything that hits your P&L when someone works.
Accurate time tracking made effortless.
GoTimio empowers your team to log, monitor, and manage work hours seamlessly.
- Real-time time tracking
- Automated timesheet approvals
- Payroll and billing integration
No credit card required
-
30 billable staff (developers, consultants, designers)
-
8 project support (PMs, BAs, QA)
-
7 sales and marketing
-
5 admin and operations
Each category needs different treatment in your cost model. Billable staff costs flow directly to projects based on logged hours. Project support gets allocated based on project complexity and duration. Sales and marketing becomes part of your overhead pool. Admin spreads evenly across all revenue-generating activity.
Here's where most models break: they treat all billable staff identically. Your $200k senior architect and $60k junior developer both get mapped to the same blended rate. This guarantees every project with senior-heavy staffing looks wildly profitable while junior-led projects appear to hemorrhage money.
Instead, create rate bands based on actual compensation ranges:
| Rate Band | Annual Comp Range | Loaded Cost/Hour | Standard Bill Rate | Target Margin |
|---|---|---|---|---|
| Junior | $50k-$70k | $45-$55 | $95-$110 | 55-60% |
| Mid | $70k-$100k | $55-$75 | $125-$145 | 48-55% |
| Senior | $100k-$140k | $75-$95 | $165-$195 | 45-52% |
| Principal | $140k+ | $95-$120 | $215-$275 | 42-50% |
When creating rate bands, use twelve months of payroll data to avoid seasonal distortions.
The loaded cost includes benefits, payroll taxes, and a proportional share of direct support costs. Standard bill rates reflect market positioning, not just cost-plus pricing. Target margins decrease at higher levels because senior people typically run lower utilization rates — that's just how it works.
Overhead absorption patterns that match operational reality
Traditional absorption models spread overhead like peanut butter — evenly across everything. This works fine if all your projects consume overhead equally. They don't.
A two-week website refresh barely touches your infrastructure. A six-month enterprise implementation consumes massive chunks of management attention, office resources, and support staff time. Spreading costs evenly makes small projects look expensive and large projects look cheap, which drives exactly the wrong decisions.
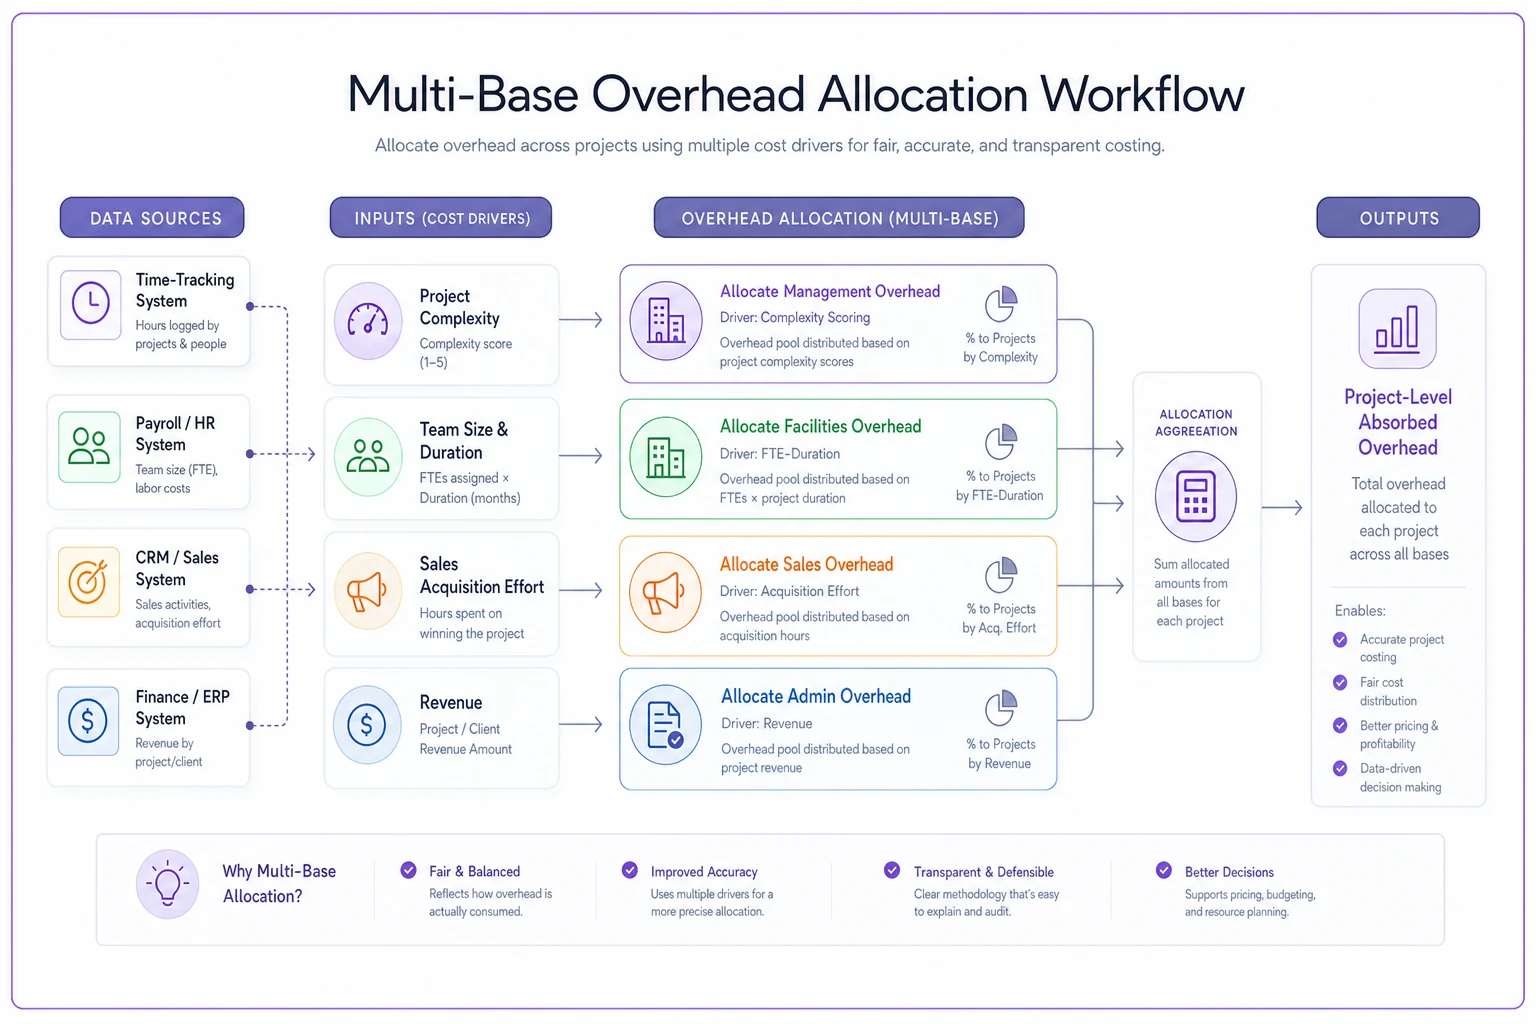
Better absorption models use multiple allocation bases:
Management overhead follows project complexity, not just hours. Measure complexity through factors like number of stakeholders, technical dependencies, and change request frequency. A 500-hour project with one decision-maker needs far less management than a 500-hour project with six departments arguing about requirements.
Facility and infrastructure costs track team size and duration. A ten-person team working for three months uses significantly more office resources than two people working for a week, even if total hours are similar.
Sales and marketing overhead varies by project acquisition cost. That enterprise deal that took nine months and fourteen meetings to close carries way more sales burden than the repeat client who called and asked for help.
Administrative overhead generally follows revenue, since larger projects typically generate more invoices, contracts, and compliance overhead.
The goal isn't perfect precision — that's impossible and mostly worthless. You want a model that reasonably approximates how projects actually consume resources while staying simple enough to maintain monthly.
Sample P&L reconstruction for a real project
Consider a mobile app development project for a regional retail chain:
Project basics:
-
Contract value
$85,000
-
Duration
14 weeks
-
Team
1 senior dev, 2 mid-level devs, 1 junior, 0.5 PM
Direct labor costs:
Based on tracked hours and mapped rates:
-
Senior dev
340 hours × $88/hour = $29,920
-
Mid devs
680 hours × $65/hour = $44,200
-
Junior
280 hours × $48/hour = $13,440
-
PM
140 hours × $78/hour = $10,920
-
Total direct labor
$98,480
Wait, already underwater? Not quite. Those 1,440 tracked hours include non-billable activities like internal standups, code review, and documentation. Actual billable hours totaled around 1,100, giving an effective utilization of roughly 76%.
Allocated overhead:
-
Management (complexity factor 1.2)
$4,800
-
Facilities (4.5 FTE for 14 weeks)
$3,150
-
Sales/marketing (standard acquisition)
$2,550
-
Admin (percentage of revenue)
$1,700
-
Total allocated overhead
$12,200
Adjusted project P&L:
-
Revenue
$85,000
-
Direct labor (productive hours only)
$75,000
-
Allocated overhead
$12,200
-
Other direct costs (software, travel)
$2,400
-
Net margin
-$4,600 (-5.4%)
This project lost money — but not because of an obvious labor overrun. The real culprit was scope creep that pushed the timeline from 10 to 14 weeks without a corresponding price adjustment. Those extra four weeks consumed overhead and reduced team utilization on other projects running in parallel.
Common reconciliation failures between HR and Finance
The biggest arguments happen when HR's numbers don't match Finance's project calculations. HR shows the project used 1,440 hours. Finance calculates costs based on 1,100 billable hours. The missing 340 hours create endless arguments about what "counts" toward project profitability.
HR tracks every hour worked because they manage capacity and prevent burnout. Finance only cares about hours that generate revenue or directly support it. Neither perspective is wrong — but using one dataset for both purposes guarantees confusion.
The reconciliation breaks down in predictable spots:
Utilization calculations differ wildly. HR calculates utilization as billable hours divided by total available hours (usually 2,080 annually). Finance calculates it as billable hours divided by total paid hours including PTO, holidays, and training. A person with 75% utilization in HR's model might show 58% in Finance's version.
Overhead allocation methodologies clash. HR wants overhead spread based on headcount to show true per-employee costs. Finance wants it spread based on revenue contribution to match accounting standards. Project managers just want consistent numbers they can actually use for estimates.
Time categorization creates gray areas. Is a client meeting billable? What about travel time? Internal architecture discussions that benefit multiple projects? Every company draws these lines differently, but rarely documents the decisions clearly enough for consistent application.
Build explicit crosswalks between HR and Finance data. Document which hours flow where and why. Create standard adjustments for the predictable differences. Most importantly, make sure both departments understand they're measuring different things for different purposes — that clarity alone eliminates most of the arguments.
Building audit trails that satisfy external scrutiny
Eventually someone will demand proof that your project P&L numbers are real. Maybe it's an investor during due diligence. A government auditor reviewing a cost-plus contract. Or just a skeptical board member who thinks the numbers look too clean.
Your model needs clear documentation showing:
-
How rates map to actual costs. Keep quarterly snapshots of your rate tables showing the relationship between compensation bands and billing rates. Include the underlying data and calculations.
-
Overhead allocation methodology. Document why you chose specific allocation bases and how you calculate the rates. Include examples showing how overhead flows to actual projects.
-
Period reconciliations. Monthly comparisons between your model's predictions and actual financial results. When variances occur, document why and whether model adjustments are needed.
-
Change history. Track every modification to rates, allocation methods, or cost pools. Include who approved changes and why they were necessary.
The documentation doesn't need to be elaborate. A simple spreadsheet with clear formulas beats a complex system nobody understands. The key is consistency — same methodology every month so trends mean something.
Warning signs your model is misleading you
Even solid models drift over time as operations evolve. Watch for these signals:
-
Your highest-margin projects consistently run late or over budget. This usually means you're underestimating the true cost of complex work — often because the model doesn't capture coordination overhead or rework cycles.
-
Project managers revolt against the numbers. When experienced PMs consistently say the model doesn't match their reality, listen. They're seeing costs your model misses.
-
Profitability swings wildly between similar projects. Some variation is normal. Massive swings mean your allocation methodology doesn't reflect how projects actually consume resources.
-
Small projects always look unprofitable. This often means fixed overhead allocation is overwhelming actual project economics. You might need separate models for different project categories.
Nobody trusts the monthly reports. When stakeholders build their own shadow calculations because they don't believe the official numbers, the model has lost credibility. At that point, you need to rebuild with better stakeholder input from the start.
Technology's role in maintaining model accuracy
Manual P&L reconstruction works for a handful of projects. Once you're juggling 20-plus concurrent projects with 50-plus people, spreadsheets become a full-time job. The math isn't complex — gathering clean data from multiple systems is what kills productivity.
Modern operational platforms can automate most of this. They pull time data from your tracking system, cost data from payroll, project details from your PM tools, and generate P&L views automatically using your documented methodology. More importantly, they maintain audit trails and flag anomalies before they turn into real problems.
The automation doesn't replace judgment. You still need to define allocation rules, set rates, and investigate variances. But it eliminates the data wrangling that prevents most companies from maintaining accurate profitability views consistently.
AI-powered platforms go further by identifying patterns in historical data — spotting when certain project types consistently underperform, when specific team combinations create efficiency gains, or when overhead allocations have drifted from operational reality. That kind of pattern recognition helps you adjust the model before profitability problems start compounding.
Turning insights into operational improvements
Accurate project P&L isn't just about measurement. Once you know true project profitability, you can make better decisions about which work to pursue, how to price it, and how to staff it.
Start with your least profitable project category. Usually these are small, complex projects that consume disproportionate overhead. You have three realistic options: raise prices to cover true costs, standardize delivery to reduce complexity, or stop accepting this work entirely.
Then look at your most profitable projects. What makes them work? Can you replicate those characteristics? Often it's not about the work itself but how delivery is organized — specific team structures, established workflows, tighter scope management.
Look at utilization patterns across roles too. If senior staff consistently shows low billable utilization, you might be leaning on them too heavily for mentoring or internal work. Either adjust billing rates to compensate or restructure teams to better leverage senior expertise where it actually matters.
The goal is predictable profitability. Not every project needs to hit the same margin, but you should understand why margins vary and whether those variations align with actual strategic priorities. A loss-leader project that opens a new market segment might be worth it. A loss-leader that just keeps people busy is a slow bleed.
Making this sustainable
Building a defensible P&L model is just the start. Maintaining it as your business evolves requires real discipline. Too many companies build elaborate models that decay into uselessness within six months because nobody keeps them up.
Keep the model as simple as possible while still capturing operational reality. Resist adding precision that doesn't improve decisions. Update rates and allocation bases quarterly, not monthly. Document changes and why they were made. Train more than one person on maintenance so it doesn't become a single-point-of-failure situation.
Most importantly, actually use the model to make decisions. When it shows a client category is unprofitable, adjust pricing or walk away. When it reveals operational inefficiency, fix it. A model that doesn't drive action is just expensive theater.
Getting from tracked time to real profitability insights isn't technically complex, but it requires genuine coordination across HR, Finance, and Operations. Get the model right, maintain it consistently, and you'll have the data to make confident decisions about which projects to pursue, how to price them, and how to structure delivery for margins that actually hold up.
Ready to optimize your workforce time management?
Join 2,000+ companies using GoTimio to improve timesheet accuracy, reduce payroll errors, and boost team productivity.