
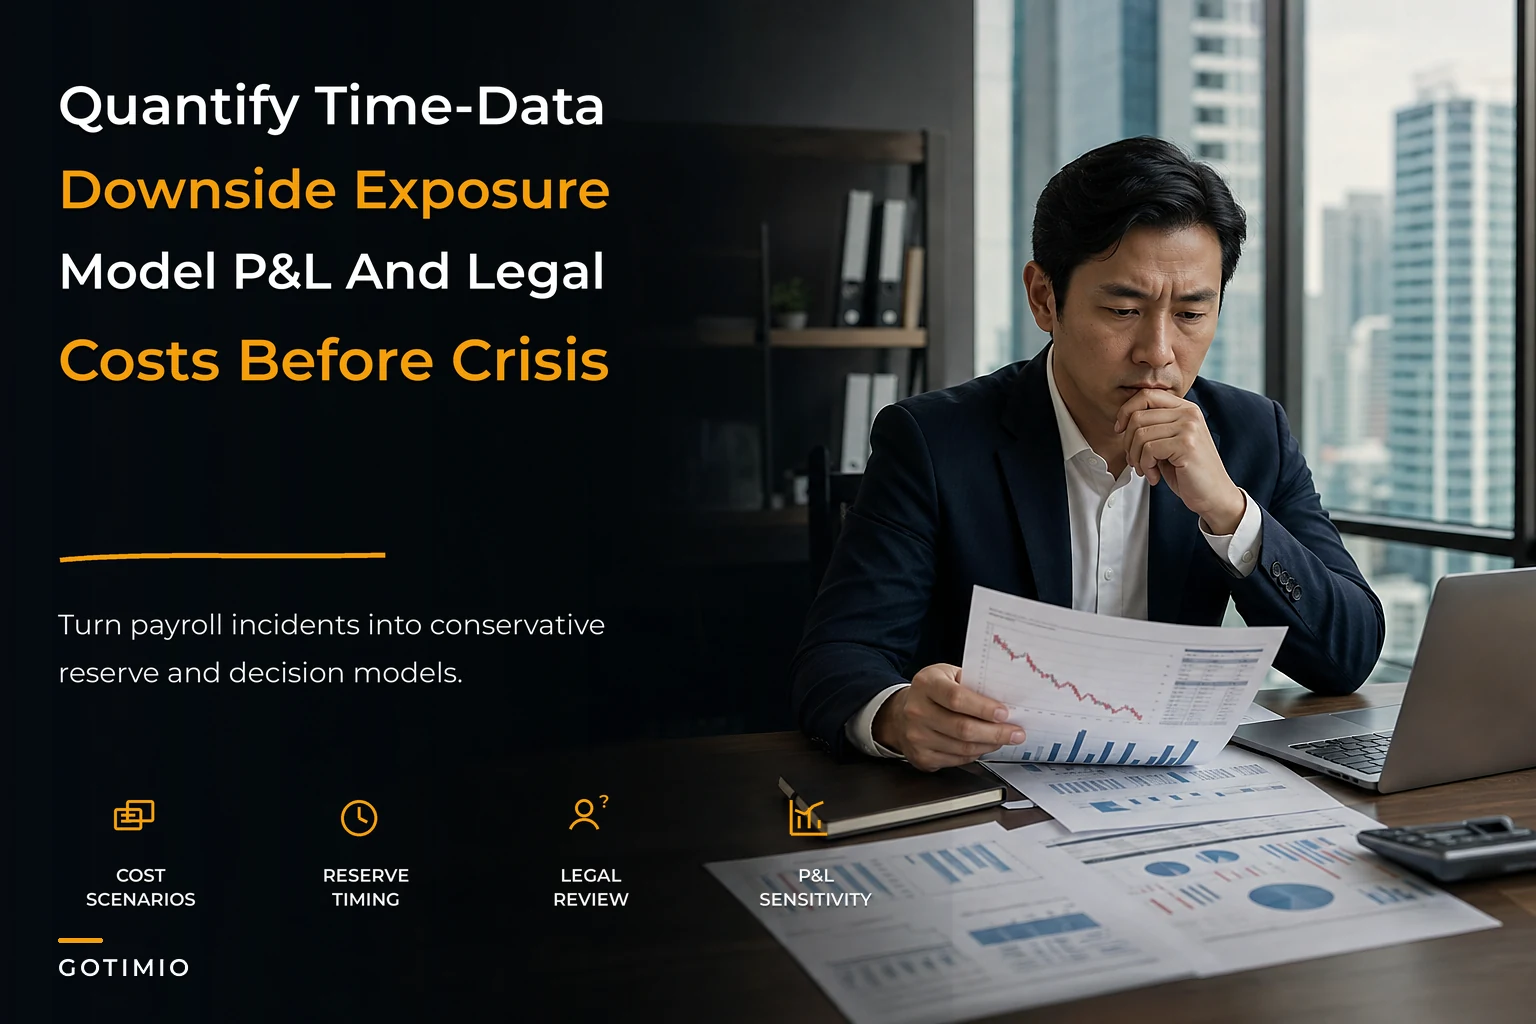

Most finance leaders can tell you the cost of their timekeeping software to the penny. Ask them what a 48-hour payroll outage would cost in gross wages, legal exposure, retention damage, and audit remediation, and you get a shrug or a wild guess. That gap is the whole problem. Boards approve spending against ROI narratives all day long, but they rarely see a disciplined estimate of downside exposure — the money that leaks out when time data breaks, not the money you might save when it works.
This is a framework for quantifying that downside. Not upside. Not ROI. The specific job here is to translate time-data incidents — a missed payroll cutoff, a corrupted feed, a misclassification that went unnoticed for three pay cycles — into conservative numbers a CFO can defend in front of a board, and into contingency reserves finance can actually set aside.
The tone matters. If you model downside optimistically, you lose credibility the first time reality overshoots your estimate. The whole point of time-data risk quantification is to be the person in the room whose worst-case number turns out to be roughly right — not the one whose rosy projection got embarrassed by an actual incident.
Why finance keeps underpricing time-data risk
The pattern across most mid-sized businesses: time-data problems don't show up as a single catastrophic event. They show up as a slow bleed that never gets consolidated into one line item. A few hours of missed overtime here. A retro adjustment there. A one-off legal consult after a misclassification complaint. Each incident gets expensed separately, often under different cost centers, so nobody ever sees the aggregate.
When the costs are scattered, they feel small. Pull them into one model and they're usually 3–5x bigger than anyone guessed.
There's also a structural reason this stays invisible. The people who feel time-data failures — payroll clerks, line managers, HR coordinators — aren't the people who build financial models. And the people who build financial models rarely sit close enough to operations to know that the Tuesday-night feed from the warehouse fails about once a quarter. So the risk lives in an organizational blind spot: too operational for finance, too financial for operations.
A typical example looks like this. A distribution company with around 400 hourly employees had three payroll "incidents" in a year — one feed failure, one rounding-rule misconfiguration, and one delayed cutoff during a system migration. Each was treated as a nuisance and cleaned up quietly. When someone finally totaled the remediation hours, emergency payroll runs, interest on a late tax deposit, and one legal review, the year's real cost landed somewhere around $90k–$110k. The CFO had budgeted exactly $0 for it, because it had never been named as a category.
The three cost layers you have to separate
The biggest mistake in time-data risk modeling is lumping everything into one "incident cost" number. Boards don't trust blobs. You need to decompose exposure into layers that behave differently and scale differently.
Accurate time tracking made effortless.
GoTimio empowers your team to log, monitor, and manage work hours seamlessly.
- Real-time time tracking
- Automated timesheet approvals
- Payroll and billing integration
No credit card required
Layer 1 — Direct payroll cost. Gross wages paid incorrectly, emergency pay runs, correction labor, bank fees, and tax-deposit penalties. These are the easiest to estimate and the hardest to argue with, which is why they anchor every model.
Layer 2 — Legal and compliance cost. Wage-and-hour exposure, statutory penalties, settlement reserves, and the cost of defensibility (or lack of it). This layer is lumpy — it's zero most years and then very large in one. That's exactly why it belongs in a contingency reserve, not an operating budget.
Layer 3 — Operational and trust cost. Retention damage after repeated pay errors, management time lost to firefighting, and the slower, compounding cost of employees who stop trusting their paychecks. Hardest to quantify, easy to dismiss, and often the most expensive over a multi-year horizon.
The reason to keep them separate: they respond to completely different controls. Layer 1 is fixed with reconciliation and cutoff discipline. Layer 2 is fixed with audit trails and classification governance. Layer 3 is fixed with reliability over time. Blend them and you can't tell the board which investment reduces which exposure.
A worked payroll-outage model
Let's build the kind of model you'd actually show a board. The scenario: a single payroll cycle fails to process on time because the time feed didn't land before cutoff. Assume a company with about 250 hourly employees, average gross pay of roughly $1,900 per biweekly cycle.
Here's a conservative downside build-up for a two-day delayed payroll run:
| Cost component | Conservative estimate | Basis |
|---|---|---|
| Emergency off-cycle payroll processing | $2,500–$4,000 | Provider fees + manual run |
| Correction & reconciliation labor | $6,000–$9,000 | ~120–160 hours across HR/payroll/finance |
| Tax deposit penalty + interest | $1,500–$5,000 | Late federal/state deposit, size-dependent |
| Expedited bank fees / wire costs | $800–$2,000 | Same-day funding for affected employees |
| Legal/consult review (if complaints) | $0–$12,000 | Triggered only if wage-timing complaint filed |
| Retention/trust impact (modeled) | $5,000–$20,000 | Fraction of replacement cost for at-risk staff |
| Total modeled downside (single event) | ~$16k–$52k | Wide band on purpose |
Two things to notice. First, the range is wide — and you keep it wide. A single-point estimate for a probabilistic event is a lie with decimal places. Second, the trust/retention line and the legal line are the ones that blow up the top of the range, and they're the two most people leave out entirely.
Now layer in frequency. If this type of event happens about once every 18 months, your annualized expected exposure is roughly $11k–$35k. That annualized number is what justifies a contingency reserve. The single-event number is what justifies the emergency runbook.
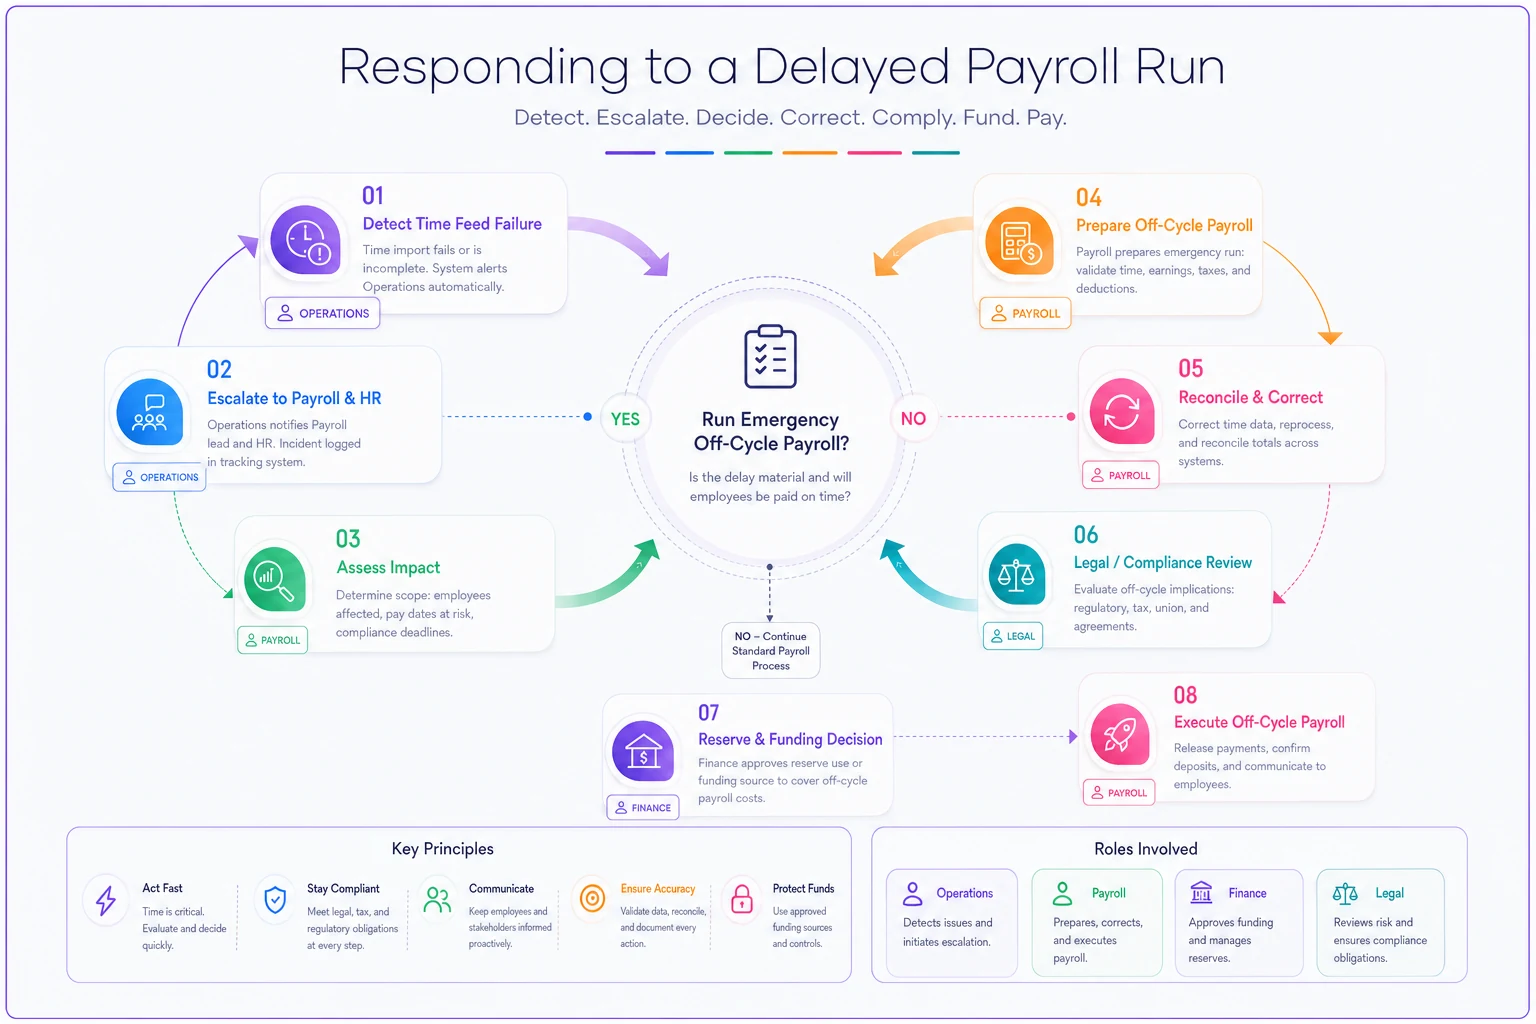
Simple flow of the response steps for a delayed payroll run.
Turning single events into a scenario matrix
Boards think in scenarios, not point estimates. So the next step is a matrix that crosses incident type against severity, giving you a grid of modeled exposures instead of one number everyone will argue about.
Build it with three severity tiers:
-
Contained — caught before payroll impact, cleaned up internally, no external party notices.
-
Payroll-impacting — employees paid wrong or late, correction required, some trust damage.
-
Escalated — external exposure
a complaint, a regulator, an audit finding, or a public stumble.
Then run your main incident types down the side: feed failure, misclassification, rounding/grace misconfiguration, retroactive-rate error, and data-integrity corruption. Each cell gets a conservative dollar band and a rough likelihood.
The power of the matrix isn't precision — it's that it forces honest conversations about which failures live in the "escalated" column. In practice, misclassification and rounding errors are the ones that quietly migrate from "contained" to "escalated" because they compound across pay periods before anyone notices. A feed failure is loud and gets fixed. A misclassification is silent and accrues penalties the whole time it's wrong.
That silent-accrual property is why defensibility matters so much. Much of your Layer 2 exposure isn't the error itself — it's your inability to prove when it started and how you corrected it. Keeping clean, exportable records is what collapses the top of your legal band, and the mechanics of that are worth treating as their own discipline, closely tied to how you handle the broader timesheet data lifecycle and e-discovery posture.
Sizing the contingency reserve
Once you have annualized expected exposure per incident type, the reserve math is straightforward — but easy to get wrong in one specific way: people reserve against the expected value and get caught flat when a tail event lands.
The conservative approach is to reserve against expected annual exposure plus a buffer sized to the single largest credible escalated event. If your annualized blended exposure is around $40k but your worst credible single escalated event models at $150k, a reserve of only $40k is false comfort. A defensible reserve sits somewhere between the expected annual figure and a meaningful fraction of the tail — the exact point depends on your risk appetite and cash position.
A clean reserve template has four columns per incident type:
-
Annualized expected exposure (midpoint of your bands)
-
Worst credible single-event exposure (top of your escalated band)
-
Current mitigation level (what controls exist today)
-
Recommended reserve contribution
The last column is where finance and operations negotiate. If a control is strong — tested feeds, enforced cutoffs, clean audit trails — the reserve contribution drops. If a control is nonexistent, the reserve has to carry the risk instead. This makes the trade-off explicit: invest in the control, or fund the reserve. Boards respond well to that framing because it's an honest choice, not a sales pitch.
The sensitivity table — where the exposure actually hides
A single model is fragile because it depends on assumptions nobody has validated. A sensitivity table is how you stress-test it and find out which assumption actually drives your number.
Pick your three or four most uncertain inputs — typically incident frequency, correction-labor hours, legal-trigger probability, and retention impact — and flex each one up and down while holding the others steady. Nine times out of ten, you discover that total exposure is overwhelmingly sensitive to one variable.
Focus initial improvement on reducing correction-labor hours; it's usually the highest-leverage fix.
In most models, the dominant driver isn't the dramatic one. It's correction-labor hours. Legal costs are scary but rare. Retention damage is real but slow. Correction labor, though, shows up in every single incident, scales with headcount, and compounds when your reconciliation process is manual. A company that spends 160 hours cleaning up each incident has a fundamentally different risk profile than one that spends 30 — even at identical incident frequency.
That insight changes the investment conversation entirely. The highest-leverage way to reduce downside exposure usually isn't buying legal insurance or chasing a perfect feed. It's shortening the correction cycle so every incident costs a fraction of what it used to.
When this framework makes sense — and when it doesn't
When it makes sense: You have more than roughly 150 employees, multiple pay rules, any shift or hourly complexity, or integrations between time capture and payroll that can break independently. At that point, time-data risk is real money and deserves a model.
When it's overkill: A 20-person salaried team with a single payroll provider and no hourly complexity doesn't need a scenario matrix. For them, the honest answer is "the exposure is small, here's a one-paragraph note, move on." Building a nine-cell matrix for trivial risk just burns credibility.
Who should not run this: Don't hand this to someone who'll treat the output as precise. The entire value is in conservative ranges that hold up. A modeler who collapses every band to a single confident number will produce something worse than no model at all — a false sense of certainty the board will later resent.
A realistic before-and-after
A regional services firm with around 300 field and hourly staff had a recurring problem: their mobile time feed failed intermittently, and each failure triggered a frantic manual reconciliation before payroll cutoff. Nobody had ever modeled it. It was just "the thing that ruins one Thursday every couple of months."
When they finally built the exposure model, the numbers were sobering. Correction labor alone ran about 140 hours per incident across three departments. At a blended loaded cost, that was roughly $7k–$8k per event in labor — before counting the off-cycle runs and the one wage-timing complaint that had cost them a legal consult the prior year. Annualized, the honest downside sat somewhere around $45k–$60k, none of it ever budgeted.
What changed wasn't a heroic fix. They tightened feed-reliability expectations with their provider, enforced a hard cutoff with a buffer, and pre-built the reconciliation steps so cleanup dropped from 140 hours to around 40. The residual exposure didn't go to zero, but the sensitivity analysis had told them exactly where to push. Within two cycles, the "ruined Thursday" stopped being a scramble and became a 90-minute checklist. The reserve they set aside for the remaining tail risk was small, deliberate, and — for the first time — defended with actual numbers.
Part of what made that durable was holding their feed provider to explicit reliability terms, which is a lot easier when you've already defined them in a vendor SLA framework for time feeds rather than negotiating under pressure mid-incident.
The one-page executive slide
Everything above collapses into a single slide, because that's what actually gets decisions made. The board doesn't read the sensitivity table; they read the conclusion it produces. A good one-pager has exactly four blocks:
-
Modeled annual downside exposure — a range, not a point. "~$45k–$60k, driven primarily by correction labor."
-
Worst credible single event — the tail number that justifies the reserve. "Up to ~$150k if an escalated wage-timing complaint lands."
-
Current control posture — green/yellow/red across your main incident types, so gaps are visible at a glance.
-
The decision — invest in the control that cuts the dominant driver, fund the reserve, or accept the risk. One of three, stated plainly.
Forcing it onto one page is what keeps the framework honest. If you can't summarize your exposure in four blocks, you don't understand it yet — you're hiding uncertainty behind volume.
How this connects to the rest of your time-data system
Downside exposure isn't a standalone exercise. It's the financial mirror of everything else your time-data operation does. Weak audit trails inflate your legal band. Manual reconciliation inflates your correction-labor driver. Loose privacy and consent handling opens a whole exposure category this model doesn't even price — which is why the way you handle employee time-data governance, privacy, and consent feeds directly back into how large your tail risk gets.
Once you've quantified downside properly, you've earned the right to have the upside conversation too. The two are complementary: this framework protects the floor, while a disciplined ROI model for your time and attendance system builds the case for the ceiling. Boards trust the upside number a lot more when they've seen that the same team modeled the downside conservatively first.
Bringing it together
Time-data risk stays mispriced because nobody owns the aggregate. The costs are real, recurring, and scattered across cost centers until someone deliberately pulls them into one model built on conservative ranges. Do that, and three things change: finance can size a reserve instead of getting surprised, operations can see which control actually moves the number, and the board gets a decision framed as an honest trade-off rather than a vague worry.
You don't need perfect data to start. You need honest bands, a scenario matrix that separates contained incidents from escalated ones, a sensitivity table that reveals your dominant driver, and a one-page slide that forces clarity. Build those, keep your worst-case numbers conservative enough that reality rarely beats them, and you'll be the person in the room whose estimate turned out to be right — which, for downside work, is the only credibility that matters.
Time-data risk stays mispriced because nobody owns the aggregate. The costs are real, recurring, and scattered across cost centers until someone deliberately pulls them into one model built on conservative ranges. Do that, and three things change: finance can size a reserve instead of getting surprised, operations can see which control actually moves the number, and the board gets a decision framed as an honest trade-off rather than a vague worry.
You don't need perfect data to start. You need honest bands, a scenario matrix that separates contained incidents from escalated ones, a sensitivity table that reveals your dominant driver, and a one-page slide that forces clarity. Build those, keep your worst-case numbers conservative enough that reality rarely beats them, and you'll be the person in the room whose estimate turned out to be right — which, for downside work, is the only credibility that matters.
Ready to optimize your workforce time management?
Join 2,000+ companies using GoTimio to improve timesheet accuracy, reduce payroll errors, and boost team productivity.